Surgical Technologist Hourly Pay in Torrance, CA: $41.61 (2026)
Quick Answer:Hourly pay for a surgical technologist working in Torrance, CA runs $41.61 at the median for 2026 — annualizing to $86,549 at a standard 2,080-hour year. Figures projected from BLS OEWS 2025 (SOC 29-2055). Weighted against Torrance's regional price level (BEA RPP 113.1, 13% above national), each hour of work buys what $36.79 nationally would. A 24-hour part-time schedule grosses $51,932 per year.
Based on BLS state-level estimates · View source
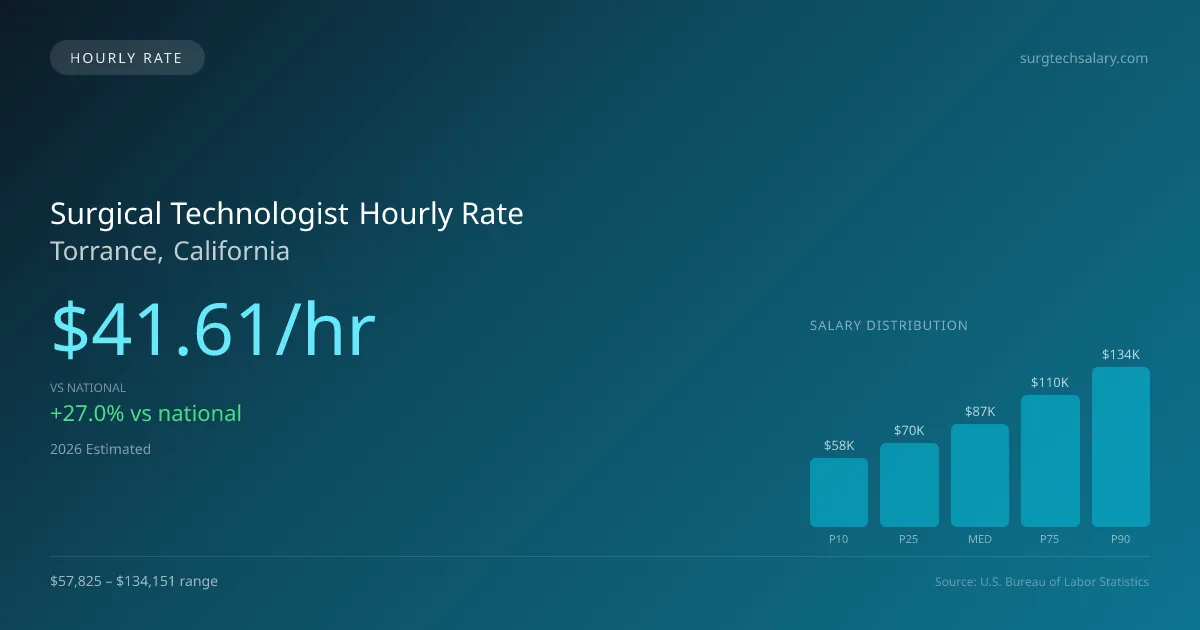
Surgical technologists in Torrance, California can expect a median hourly pay of $41.61, significantly higher than the national median hourly rate of $32.76, illustrating a robust demand for skilled professionals in the healthcare sector. This competitive hourly wage is particularly advantageous for those seeking part-time roles or per-diem work, commonly found in various surgical settings such as hospital operating rooms, ambulatory surgery centers, and specialty surgical facilities. For individuals starting in the field, hourly rates begin at approximately $27.80, while experienced surgical technologists can earn as much as $64.49 per hour. These figures, estimated from annual salary data, reflect the current hiring market and the critical role that surgical technologists fulfill in ensuring the success of surgical procedures.
About the Torrance Market
Salary estimated from California average ($78,000) adjusted for local cost of living.
Surgical Technologist Hourly Wage Breakdown
| Percentile | Hourly Rate | Per 8hr Shift |
|---|---|---|
| Entry Level (P10) | $27.80 | $222.44 |
| Lower Range (P25) | $33.77 | $270.16 |
| Median (P50) | $41.61 | $332.90 |
| Upper Range (P75) | $53.06 | $424.47 |
| Top Earners (P90) | $64.49 | $515.95 |
Estimated Annual Income by Work Schedule in Torrance
Based on $41.61/hr median hourly rate · 2026 est.
At $41.61/hr, a surgical technologist working full-time (40 hr/wk) in Torrance, CA can expect to earn approximately $86,553 per year (2026 est.). Part-time hygienists working 24 hours per week would earn around $49,934. With a cost-of-living index of 113.10 (above the national average), these earnings may be offset by higher expenses in Torrance.
Hourly Rate Calculator
Schedule Comparison in Torrance
| Schedule | Weekly | Monthly | Annual |
|---|---|---|---|
| Full-Time (40 hrs) | $1,664.48 | $7,213 | $86,553 |
| Part-Time (24 hrs) | $998.69 | $4,328 | $51,932 |
| Per Diem (16 hrs) | $665.79 | $2,885 | $34,621 |
Compare Surg Tech, CST Wages With Similar Roles
| Role | Median Hourly |
|---|---|
| Surgical Technologist (Torrance) | $41.61 |
| Registered Nurse (National Avg) | $42.80 |
| Licensed Practical Nurse (National Avg) | $29.36 |
| Medical Lab Technician (National Avg) | $28.18 |
| Radiologic Technologist (National Avg) | $36.78 |
Surgical Technologists in Torrance, CA earn a median of $86,549 per year (2026 est.), which is 27.01% higher than the national median of $68,141 and 1.70% above the California state average of $85,102.
Surgical Technologist Hourly Pay vs. Cost of Living
Working 24h/week at $41.61/hr = $51,932/year (purchasing power: $45,917).
Working 40h/week (full-time) = $86,553/year (purchasing power: $76,528).
CoL index: 113.1 (100 = national average).
2019 BLS Actual
$29.50/hr
2025 BLS Actual
$39.48/hr
2026 Current Est.
$41.61/hr
2019–2027 Growth
+48.7%
Hourly Rate Trajectory for Surgical Technologists in Torrance (2019–2027)
2019–2025: actual BLS OEWS data for this metro area. 2026+: CAGR 5.40% projection.
| Year | Hourly Rate | Status |
|---|---|---|
| 2019 | $29.50/hr | Actual |
| 2020 | $30.36/hr | Actual |
| 2021 | $29.64/hr | Actual |
| 2022 | $34.17/hr | Actual |
| 2023 | $37.01/hr | Actual |
| 2024 | $43.14/hr | Actual |
| 2025 | $39.48/hr | Actual |
| 2026(current) | $41.61/hr | Estimated |
| 2027 | $43.86/hr | Projected |
Based on 7 years of BLS OEWS metropolitan area data, the median hourly rate for surgical technologists in Torrance grew 33.9% from $29.50/hr (2019) to $39.48/hr (2025). At a 5.40% projected growth rate, hourly pay is expected to reach $43.86/hr by 2027. Part-time and per-diem surgical technologists can use this multi-year trend to benchmark future contract negotiations.
Note: Historical values (2019–2025) are actual BLS OEWS figures for the Torrance metropolitan area, sourced from annual Occupational Employment and Wage Statistics surveys. 2026–2026 figures are current estimates, and 2027 values are projections, calculated using a 5.40% CAGR derived from 7-year BLS historical data. Actual salaries may vary based on employer, experience, certifications, and local market conditions.
Working as an Hourly Surgical Technologist in Torrance
Analyzing the earning potential for surgical technologists reveals interesting opportunities, especially for those considering part-time or per-diem positions. A surgical technologist working three days a week could expect to earn approximately $52,000 annually, which is a solid income compared to a full-time role earning around $86,549. Per-diem surgical technologists in Torrance often charge between $35 to $55 per hour, with those specializing in cardiovascular or neurosurgery potentially billing at rates of $50 to $75 per hour. Travel surgical tech contracts further amplify earning possibilities, offering between $1,800 and $2,800 per week, particularly for high-demand specialties. In addition to compensation, factors such as employer type influence hourly rates; positions within hospitals may offer benefits at a lower hourly pay, while specialized surgical centers might provide higher pay without additional perks. When negotiating, surgical technologists should consider their unique value and be prepared to discuss their certifications, including the CST credential, and any specialized training, like robotic surgery, as leverage for better rates.
More salary data for Torrance, CA:
Frequently Asked Questions
What is the hourly rate for surgical technologists in Torrance in 2026?
How much do part-time surgical technologists make in Torrance?
Are surgical technologists in Torrance paid hourly or salary?
How much does a full-time surgical technologist make per year in Torrance?
Do surgical technologists earn more per hour working part-time in Torrance?
Related Pages
Compare Salaries
Career Resources
Nearby Cities in California
Written by Jessica Thompson, BA, CST
Career Analyst
Jessica has over 10 years of experience as a surgical technologist. She specializes in orthopedic surgical procedures. Jessica works at a community hospital.
Methodology & Data Source
Hourly wage figures on this page are 2026 projections based on the Bureau of Labor Statistics Occupational Employment and Wage Statistics (OEWS) survey, May 2026 release. A 5.40% compound annual growth rate (CAGR), derived from 6-year national BLS wage trends, was applied to estimate current 2026 hourly rates for surgical technologists in Torrance. Part-time and full-time income estimates assume consistent weekly hours and do not account for overtime, benefits, or seasonal variation.
Data Sources & Methodology
Salary data for Torrance is estimated from official BLS state-level occupational wage data (2025), adjusted for regional cost-of-living differences using BEA RPP (Regional Price Parities).
2026 figures are projected from 2025 BLS data using a compound annual growth rate (CAGR) of 5.40%, derived from historical BLS wage trends for surgical technologists (SOC 29-2055).
Compiled and verified by Jessica Thompson, BA, CST, a licensed surgical technologist with 10+ years of clinical experience. · View source data at BLS.gov