Surgical Technologist Salary in Illinois: $68,316 (2026)
Quick Answer:Across Illinois's 65 metropolitan areas, the average median surgical technologist pay sits at $68,316/year heading into 2026 — a figure projected from 2025 BLS OEWS wage data for SOC 29-2055. Because Illinois sits at BEA RPP 97.1 (3% below the U.S. baseline), that statewide median translates to roughly $70,356 in nationally-comparable purchasing power. Highest-paying metros: Bloomington ($68,140), Naperville ($67,053), Chicago ($66,360).
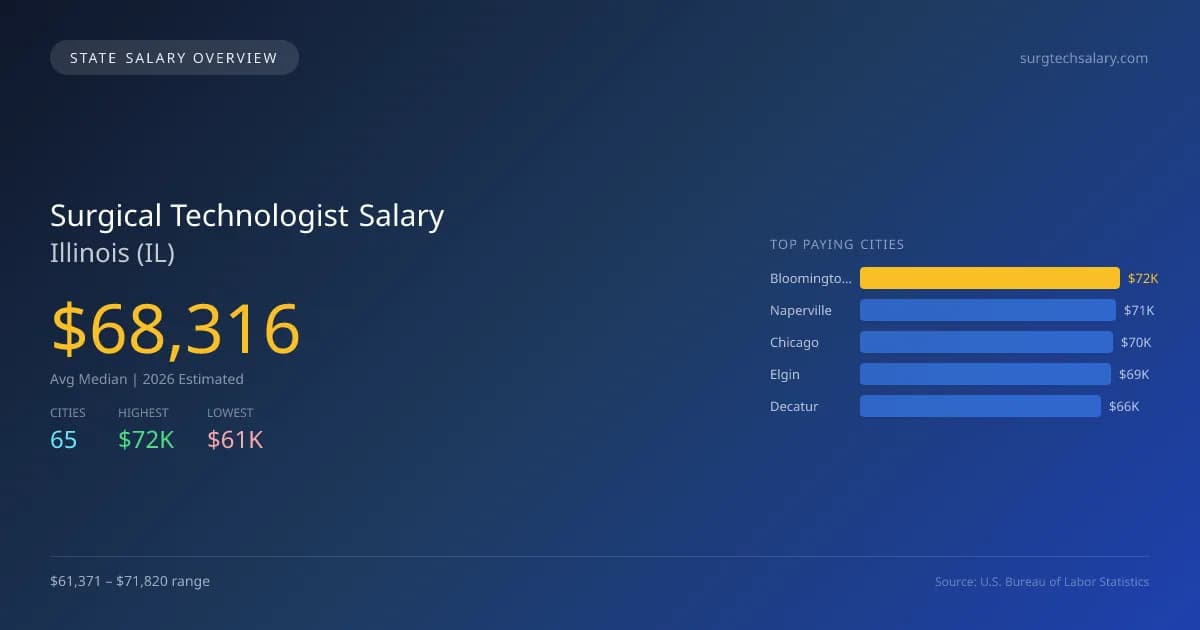
In 2026, the average median salary for surgical technologists in Illinois is projected to be $68,316, slightly higher than the national median of $68,141, showing a modest advantage of 0.3%. The disparity in pay across the state varies significantly, with Bloomington offering the highest average salary at $71,820, while Carbondale presents the lowest at $61,371. This difference of $10,449 can be attributed to factors such as the cost of living, availability of hospitals and surgical centers, and demand for healthcare services in various regions. Illinois has specific licensing requirements and scope of practice laws that can influence earning potential. The state's job market is witnessing a growth rate of 5.40% annually, reflecting a robust demand for surgical technologists, driven by a combination of an aging population and advancements in medical technology. Key cities projected to have competitive salaries include Naperville at $70,674, Chicago at $69,943, Elgin at $69,319, and Decatur at $66,437. Overall, the landscape for surgical technologists in Illinois presents solid earning potential and promising job stability in the coming years.
Illinois Surgical Technologist Salary Range
Overall salary range in Illinois: $43,109 (lowest entry-level) to $109,544 (highest top earner)
Illinois vs National Average
Illinois surgical technologists earn 0.26% more than the national median (+$175/year difference).
Illinois Surgical Technologist Salary Distribution (2026)
Surgical Technologist salaries in Illinois range from $51,629 (entry-level, 10th percentile) to $95,849 (top earners, 90th percentile), with a median of $68,316. The Illinois median is $175 above the US national median of $68,141. The average hourly rate is $32.85/hr. Approximately 3,758 surgical technologists are employed across 65 cities.
2019 BLS Actual
$48,679
2025 BLS Actual
$64,816
2026 Current Est.
$68,316
2019–2027 Growth
+47.9%
Salary Trajectory for Surgical Technologists in Illinois (2019–2027)
2019–2025: actual BLS OEWS data for this metro area. 2026+: CAGR 5.40% projection.
| Year | Annual Salary | Status |
|---|---|---|
| 2019 | $48,679 | Actual |
| 2020 | $50,713 | Actual |
| 2021 | $49,162 | Actual |
| 2022 | $55,574 | Actual |
| 2023 | $58,932 | Actual |
| 2024 | $62,778 | Actual |
| 2025 | $64,816 | Actual |
| 2026(current) | $68,316 | Estimated |
| 2027 | $72,005 | Projected |
Based on 7 years of BLS OEWS data for the Illinois metropolitan area, the median surgical technologist salary grew 33.1% from $48,679 (2019) to $64,816 (2025). At a 5.40% compound annual growth rate, salaries are projected to reach $72,005 by 2027 — a total increase of $23,326 (47.92%) from 2019.
Note: Historical values (2019–2025) are actual BLS OEWS figures for the Illinois metropolitan area, sourced from annual Occupational Employment and Wage Statistics surveys. 2026–2026 figures are current estimates, and 2027 values are projections, calculated using a 5.40% CAGR derived from 7-year BLS historical data. Actual salaries may vary based on employer, experience, certifications, and local market conditions.
Top 5 Highest Paying Cities in Illinois
Lowest Paying Cities in Illinois
| City | Median Salary |
|---|---|
| Carbondale | $61,371 |
| Elmhurst | $61,983 |
| Calumet City | $62,135 |
| Galesburg | $62,155 |
| Crystal Lake | $62,395 |
Best Value Cities for Surgical Technologists in Illinois
When adjusted for local cost of living, these Illinois cities offer the most purchasing power for surgical technologists.
| City | Nominal Salary | CoL Index | Adjusted Salary |
|---|---|---|---|
| Bloomington | $71,820 | 93.537 | $76,782 |
| Naperville | $70,674 | 97.1 | $72,785 |
| Elgin | $69,319 | 97.1 | $71,389 |
| Springfield | $65,970 | 92.745 | $71,131 |
| Rockford | $65,074 | 92.154 | $70,614 |
Adjusted salary = nominal salary × (100 / CoL index). CoL index: 100 = national average. Lower index = lower cost of living.
Salary by Experience Level in Illinois
| Experience Level | Estimated Annual |
|---|---|
| Entry Level (0-2 years) | $51,629 |
| Mid Career (3-7 years) | $68,316 |
| Experienced (7+ years) | $95,849 |
Estimates based on BLS percentile data averaged across Illinois metro areas. Individual pay varies by employer, certifications, and specialization.
All 65 Cities in Illinois
More Illinois Salary Data
Hourly Rates
Explore surgical technologist hourly pay in Illinois cities.
Senior / Experienced
Top earner salaries for experienced surgical technologists.
Compare Cities in Illinois
View all comparisons →Explore More Surgical Technologist Salary Data
Frequently Asked Questions
How much do surgical technologists make in Illinois in 2026?
What is the highest paying city for surgical technologists in Illinois?
How does Illinois surgical technologist pay compare to the national average?
What is the entry-level surgical technologist salary in Illinois?
How many surgical technologists are employed in Illinois?
Which Illinois city offers the best value for surgical technologists?
Written by Jessica Thompson, BA, CST
Career Analyst
Jessica has over 10 years of experience as a surgical technologist. She specializes in orthopedic surgical procedures. Jessica works at a community hospital.
Methodology & Data Source
Statewide salary figures on this page are 2026 projections based on the Bureau of Labor Statistics Occupational Employment and Wage Statistics (OEWS) survey, May 2026 release. A 5.40% compound annual growth rate (CAGR), derived from 6-year national BLS wage trends, was applied to each metro area's reported salary to estimate current 2026 surgical technologist compensation across Illinois. State averages are employment-weighted across 65 metro areas — larger metro areas with more surgical technologistscontribute proportionally more to the average, producing figures that better reflect typical compensation. Individual pay varies by city, employer, certifications, and experience.
Data Sources & Methodology
Source: BLS, OEWS, 7-year dataset (–). Per-city data from annual BLS metropolitan area surveys.
2026 figures are projected from 2025 BLS data using a compound annual growth rate (CAGR) of 5.40%, derived from historical BLS wage trends for surgical technologists (SOC 29-2055).
Compiled and verified by Jessica Thompson, BA, CST, a licensed surgical technologist with 10+ years of clinical experience. · View source data at BLS.gov