Surgical Technologist Salary in Burlington, VT: $63,936 (2026)
Quick Answer:A full-time surgical technologist in Burlington, VT earns a median $63,936/year (≈ $30.75/hour) in nominal terms for 2026 — projected from BLS OEWS 2025 (SOC 29-2055). Once you factor in Burlington's price level (1% above national, BEA RPP 100.9), that paycheck buys what $63,335 would nationally. Nominal pay sits 9.3% below the Vermont state average.
Official BLS data · View source
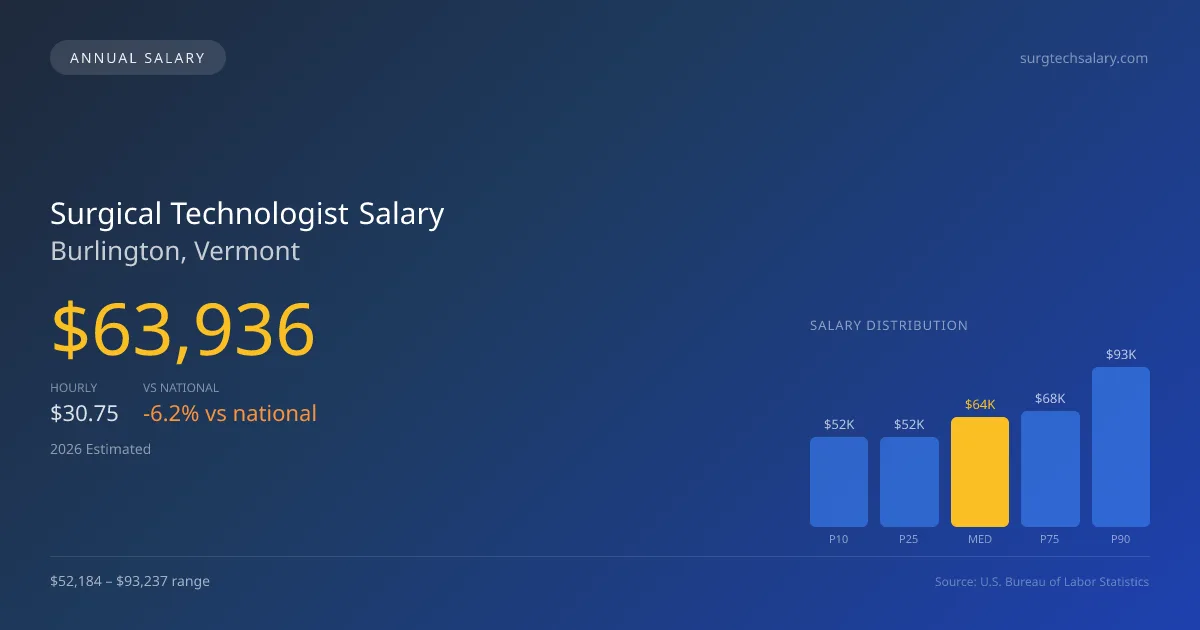
In Burlington, Vermont, surgical technologists can anticipate a median annual salary of $63,936 in 2026, reflecting the growing emphasis on specialized training, such as robotic surgery certification, which enhances earnings potential. Salary ranges for this occupation extend significantly, from $52,184 at the lower end (P10) to as high as $93,237 (P90) for those with extensive experience or specialized skills. This data is derived from official Bureau of Labor Statistics (BLS) OEWS surveys, showcasing the competitive environment for surgical technologists in the region. Opportunities in Burlington are bolstered by the increased adoption of advanced surgical techniques, making this an attractive place for professionals eager to enhance their roles and earning capacities.
Salary Breakdown
| Percentile | Annual | Hourly |
|---|---|---|
| Entry Level (P10) | $52,184 | $25.09 |
| Lower Range (P25) | $52,184 | $25.09 |
| Median (P50)(typical) | $63,936 | $30.75 |
| Upper Range (P75) | $67,720 | $32.56 |
| Top Earners (P90) | $93,237 | $44.83 |
Median Salary Position
6.17% below the national average
2026 Salary Percentile Distribution in Burlington
In Burlington, VT, the surgical technologist salary spread from the 10th to 90th percentile is $41,053 (2026 est.). At $63,936, the local median is 6.17% below the national median of $68,141.
Salary Calculator
At 40 hours/week in Burlington: You'd be in the lower-middle range
How Burlington Surgical Technologist Pay Compares
Burlington median: $63,936/year (2026)
| Compared To | Median Salary | Burlington Pays |
|---|---|---|
| Vermont Average | $70,491 | -9.30% less |
| National Average | $68,141 | -6.17% less |
Surgical Technologists in Burlington, VT earn a median of $63,936 per year (2026 est.), which is 6.17% lower than the national median of $68,141 and 9.30% below the Vermont state average of $70,491.
Cost-of-Living Adjusted Salary
Burlington has a cost of living 0.95% above the national average.
Adjusted salary = nominal × (100 / CoL index). CoL index: 100 = national average.
Burlington, VT has a cost-of-living index of 100.949 (above the national average of 100). While the nominal salary of $63,936 is competitive, the higher cost of living reduces purchasing power to an effective $63,335 — a 0.94% reduction.
Compare Purchasing Power
Select a city to see how your salary compares after cost of living
Select a city above to compare purchasing power
2019 BLS Actual
$37,040
2025 BLS Actual
$60,660
2026 Current Est.
$63,936
2019–2027 Growth
+81.9%
Salary Trajectory for Surgical Technologists in Burlington (2019–2027)
2019–2025: actual BLS OEWS data for this metro area. 2026+: CAGR 5.40% projection.
| Year | Annual Salary | Status |
|---|---|---|
| 2019 | $37,040 | Actual |
| 2020 | $46,642 | Actual |
| 2021 | $37,990 | Actual |
| 2022 | $52,506 | Actual |
| 2023 | $50,820 | Actual |
| 2024 | $57,607 | Actual |
| 2025 | $60,660 | Actual |
| 2026(current) | $63,936 | Estimated |
| 2027 | $67,388 | Projected |
Based on 7 years of BLS OEWS data for the Burlington metropolitan area, the median surgical technologist salary grew 63.8% from $37,040 (2019) to $60,660 (2025). At a 5.40% compound annual growth rate, salaries are projected to reach $67,388 by 2027 — a total increase of $30,348 (81.93%) from 2019.
Note: Historical values (2019–2025) are actual BLS OEWS figures for the Burlington metropolitan area, sourced from annual Occupational Employment and Wage Statistics surveys. 2026–2026 figures are current estimates, and 2027 values are projections, calculated using a 5.40% CAGR derived from 7-year BLS historical data. Actual salaries may vary based on employer, experience, certifications, and local market conditions.
Salary by Experience Level
| Experience | Estimated Salary Range |
|---|---|
| 0-2 years (New Graduate) | $52,184 – $52,184 |
| 3-5 years (Mid Career) | $52,184 – $63,936 |
| 5+ years (Experienced) | $63,936 – $67,720 |
| 10+ years (Top Earner) | $67,720 – $93,237 |
Surg Tech, CST salary ranges estimated from BLS percentile data. Individual surgical technologist compensation varies by employer, certifications, and specialization.
Surgical Technologist Job Market in Burlington
The local job market is relatively robust, with 90 surgical technologists currently employed in the Burlington area. However, the cost of living is slightly elevated, reflected in a Cost of Living Index of 100.949, which can influence take-home earnings. Employers in hospital operating rooms generally offer higher wages compared to ambulatory surgical centers and specialty surgical centers, such as those focused on orthopedic or cardiovascular procedures. The disparity in pay often hinges on various factors, including specialty expertise, certification in robotic surgical techniques, and roles such as surgical first assistant. To maximize earnings in Burlington, surgical technologists should focus on acquiring specialized certifications, particularly in high-demand areas like neurosurgery, and consider traveling positions, which frequently offer higher compensation packages. Understanding these dynamics will better equip professionals to navigate their salary potential effectively.
More salary data for Burlington, VT:
Frequently Asked Questions
How much do surgical technologists make in Burlington, VT in 2026?
Is Burlington, VT a good place to work as a surgical technologist?
Can surgical technologists make $100K in Burlington?
What is the cost-of-living adjusted surgical technologist salary in Burlington?
How much does a surgical technologist make per hour in Burlington?
Related Pages
Compare Salaries
Career Resources
Nearby Cities in Vermont
Written by Jessica Thompson, BA, CST
Career Analyst
Jessica has over 10 years of experience as a surgical technologist. She specializes in orthopedic surgical procedures. Jessica works at a community hospital.
Methodology & Data Source
Salary figures on this page are 2026 projections based on the Bureau of Labor Statistics Occupational Employment and Wage Statistics (OEWS) survey, May 2026 release. The BLS reported a median annual salary of $60,660 for surgical technologistsin the Burlington metropolitan area. A 5.40% compound annual growth rate (CAGR), calculated from 6-year national BLS wage trends, was applied to project current 2026 compensation. Percentile ranges (P10–P90) represent the full salary distribution across experience levels and practice settings in this market.
Data Sources & Methodology
Source: BLS, OEWS, 5-year dataset (–). Per-city data from annual BLS metropolitan area surveys.
2026 figures are projected from 2025 BLS data using a compound annual growth rate (CAGR) of 5.40%, derived from historical BLS wage trends for surgical technologists (SOC 29-2055).
Compiled and verified by Jessica Thompson, BA, CST, a licensed surgical technologist with 10+ years of clinical experience. · View source data at BLS.gov