Surgical Technologist Salary in Washington: $80,826 (2026)
Quick Answer:Across Washington's 50 metropolitan areas, the average median surgical technologist pay sits at $80,826/year heading into 2026 — a figure projected from 2025 BLS OEWS wage data for SOC 29-2055. Because Washington sits at BEA RPP 107.4 (7% above the U.S. baseline), that statewide median translates to roughly $75,257 in nationally-comparable purchasing power. Highest-paying metros: Vancouver ($82,961), Mount Vernon ($81,470), Bellevue ($80,683).
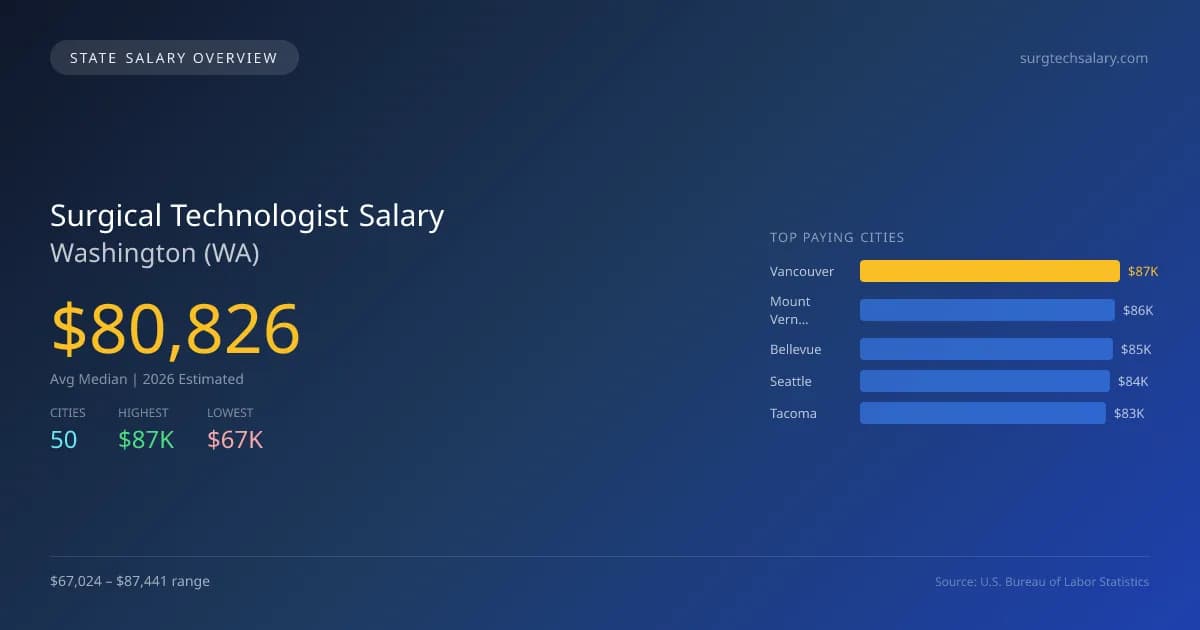
The average median salary for surgical technologists in Washington is projected to be $80,826 in 2026, which is significantly higher than the national median of $68,141, marking an increase of 18.6%. The salary range across the state varies, with Vancouver leading at $87,441, while Wenatchee offers the lowest salary at $67,024, creating a notable gap of $20,417. This discrepancy can be attributed to factors such as the local cost of living, demand for healthcare services, and the presence of larger medical facilities in metropolitan areas. In Washington, surgical technologists must meet state licensing requirements and adhere to specific scope of practice laws, which can influence their earning potential. The job market for surgical technologists is projected to grow at an annual rate of 5.40%, reflecting a rising demand for healthcare professionals. With 2,689 surgical technologists employed across various cities, regions like Mount Vernon ($85,869), Bellevue ($85,040), Seattle ($84,215), and Tacoma ($82,810) are also among the top payers in the state. The ongoing growth in the healthcare sector indicates a positive outlook for employment opportunities in this field throughout Washington.
Washington Surgical Technologist Salary Range
Overall salary range in Washington: $42,086 (lowest entry-level) to $135,534 (highest top earner)
Washington vs National Average
Washington surgical technologists earn 18.62% more than the national median (+$12,685/year difference).
Washington Surgical Technologist Salary Distribution (2026)
Surgical Technologist salaries in Washington range from $58,750 (entry-level, 10th percentile) to $109,132 (top earners, 90th percentile), with a median of $80,826. The Washington median is $12,685 above the US national median of $68,141. The average hourly rate is $38.86/hr. Approximately 2,689 surgical technologists are employed across 50 cities.
2019 BLS Actual
$58,960
2025 BLS Actual
$76,685
2026 Current Est.
$80,826
2019–2027 Growth
+44.5%
Salary Trajectory for Surgical Technologists in Washington (2019–2027)
2019–2025: actual BLS OEWS data for this metro area. 2026+: CAGR 5.40% projection.
| Year | Annual Salary | Status |
|---|---|---|
| 2019 | $58,960 | Actual |
| 2020 | $60,945 | Actual |
| 2021 | $58,129 | Actual |
| 2022 | $62,751 | Actual |
| 2023 | $74,322 | Actual |
| 2024 | $74,535 | Actual |
| 2025 | $76,685 | Actual |
| 2026(current) | $80,826 | Estimated |
| 2027 | $85,191 | Projected |
Based on 7 years of BLS OEWS data for the Washington metropolitan area, the median surgical technologist salary grew 30.1% from $58,960 (2019) to $76,685 (2025). At a 5.40% compound annual growth rate, salaries are projected to reach $85,191 by 2027 — a total increase of $26,231 (44.49%) from 2019.
Note: Historical values (2019–2025) are actual BLS OEWS figures for the Washington metropolitan area, sourced from annual Occupational Employment and Wage Statistics surveys. 2026–2026 figures are current estimates, and 2027 values are projections, calculated using a 5.40% CAGR derived from 7-year BLS historical data. Actual salaries may vary based on employer, experience, certifications, and local market conditions.
Top 5 Highest Paying Cities in Washington
Lowest Paying Cities in Washington
| City | Median Salary |
|---|---|
| Wenatchee | $67,024 |
| Yakima | $68,236 |
| Tukwila | $71,620 |
| Mountlake Terrace | $71,731 |
| Covington | $72,740 |
Best Value Cities for Surgical Technologists in Washington
When adjusted for local cost of living, these Washington cities offer the most purchasing power for surgical technologists.
| City | Nominal Salary | CoL Index | Adjusted Salary |
|---|---|---|---|
| Mount Vernon | $85,869 | 102.443 | $83,821 |
| Vancouver | $87,441 | 107.4 | $81,416 |
| Bellevue | $85,040 | 107.4 | $79,181 |
| Kennewick | $79,050 | 100.079 | $78,988 |
| Bellingham | $80,072 | 103.334 | $77,489 |
Adjusted salary = nominal salary × (100 / CoL index). CoL index: 100 = national average. Lower index = lower cost of living.
Salary by Experience Level in Washington
| Experience Level | Estimated Annual |
|---|---|
| Entry Level (0-2 years) | $58,750 |
| Mid Career (3-7 years) | $80,826 |
| Experienced (7+ years) | $109,132 |
Estimates based on BLS percentile data averaged across Washington metro areas. Individual pay varies by employer, certifications, and specialization.
All 50 Cities in Washington
| # | City | Median Salary |
|---|---|---|
| 1 | Vancouver | $87,441 |
| 2 | Mount Vernon | $85,869 |
| 3 | Bellevue | $85,040 |
| 4 | Seattle | $84,215 |
| 5 | Tacoma | $82,810 |
| 6 | Richland | $80,697 |
| 7 | Bellingham | $80,072 |
| 8 | Renton | $79,508 |
| 9 | Kennewick | $79,050 |
| 10 | Everett | $78,739 |
| 11 | Marysville | $78,149 |
| 12 | Shoreline | $77,720 |
| 13 | Redmond | $77,413 |
| 14 | Spokane Valley | $77,380 |
| 15 | Kent | $77,349 |
| 16 | Kirkland | $77,222 |
| 17 | Burien | $77,124 |
| 18 | Federal Way | $76,785 |
| 19 | Des Moines | $76,769 |
| 20 | Olympia | $76,747 |
| 21 | Auburn | $76,590 |
| 22 | Lakewood | $76,559 |
| 23 | Issaquah | $76,516 |
| 24 | Lacey | $76,081 |
| 25 | Sammamish | $76,013 |
| 26 | University Place | $75,987 |
| 27 | SeaTac | $75,927 |
| 28 | Spokane | $75,920 |
| 29 | Tumwater | $75,849 |
| 30 | Pasco | $75,602 |
| 31 | Longview | $75,567 |
| 32 | Edmonds | $75,140 |
| 33 | Lake Stevens | $74,940 |
| 34 | Lynnwood | $74,893 |
| 35 | Moses Lake | $74,749 |
| 36 | Bothell | $74,694 |
| 37 | Pullman | $74,364 |
| 38 | Puyallup | $74,195 |
| 39 | Bremerton | $73,917 |
| 40 | Ellensburg | $73,917 |
| 41 | Maple Valley | $73,715 |
| 42 | Walla Walla | $73,552 |
| 43 | Camas | $73,528 |
| 44 | Oak Harbor | $73,217 |
| 45 | Kenmore | $72,745 |
| 46 | Covington | $72,740 |
| 47 | Mountlake Terrace | $71,731 |
| 48 | Tukwila | $71,620 |
| 49 | Yakima | $68,236 |
| 50 | Wenatchee | $67,024 |
More Washington Salary Data
Hourly Rates
Explore surgical technologist hourly pay in Washington cities.
Senior / Experienced
Top earner salaries for experienced surgical technologists.
Compare Cities in Washington
View all comparisons →Explore More Surgical Technologist Salary Data
Frequently Asked Questions
How much do surgical technologists make in Washington in 2026?
What is the highest paying city for surgical technologists in Washington?
How does Washington surgical technologist pay compare to the national average?
What is the entry-level surgical technologist salary in Washington?
How many surgical technologists are employed in Washington?
Which Washington city offers the best value for surgical technologists?
Written by Jessica Thompson, BA, CST
Career Analyst
Jessica has over 10 years of experience as a surgical technologist. She specializes in orthopedic surgical procedures. Jessica works at a community hospital.
Methodology & Data Source
Statewide salary figures on this page are 2026 projections based on the Bureau of Labor Statistics Occupational Employment and Wage Statistics (OEWS) survey, May 2026 release. A 5.40% compound annual growth rate (CAGR), derived from 6-year national BLS wage trends, was applied to each metro area's reported salary to estimate current 2026 surgical technologist compensation across Washington. State averages are employment-weighted across 50 metro areas — larger metro areas with more surgical technologistscontribute proportionally more to the average, producing figures that better reflect typical compensation. Individual pay varies by city, employer, certifications, and experience.
Data Sources & Methodology
Source: BLS, OEWS, 7-year dataset (–). Per-city data from annual BLS metropolitan area surveys.
2026 figures are projected from 2025 BLS data using a compound annual growth rate (CAGR) of 5.40%, derived from historical BLS wage trends for surgical technologists (SOC 29-2055).
Compiled and verified by Jessica Thompson, BA, CST, a licensed surgical technologist with 10+ years of clinical experience. · View source data at BLS.gov