Surgical Technologist Salary in Barre, VT: $66,583 (2026)
Quick Answer:A full-time surgical technologist in Barre, VT earns a median $66,583/year (≈ $32.01/hour) in nominal terms for 2026 — projected from BLS OEWS 2025 (SOC 29-2055). Once you factor in Barre's price level (4% above national, BEA RPP 103.5), that paycheck buys what $64,331 would nationally. Nominal pay sits 5.6% below the Vermont state average.
Based on BLS state-level estimates · View source
In Barre, Vermont, surgical technologists earn a median annual salary of $66,583, which falls slightly below the national median of $68,141 for 2026. The salary range for this position varies widely, from $48,253 at the lower end (P10) to as much as $91,931 for the highest earners (P90). These figures reflect local estimates derived from BLS state-level data, taking into account regional price adjustments. Surgical technologists in Barre may find employment opportunities in diverse settings, such as hospital operating rooms and specialty surgical centers. The unique structural choices in the local healthcare system directly impact salary levels and job demand, making Barre an intriguing market for those entering or advancing in this field.
About the Barre Market
Salary estimated from Vermont average ($58,000) adjusted for local cost of living.
Salary Breakdown
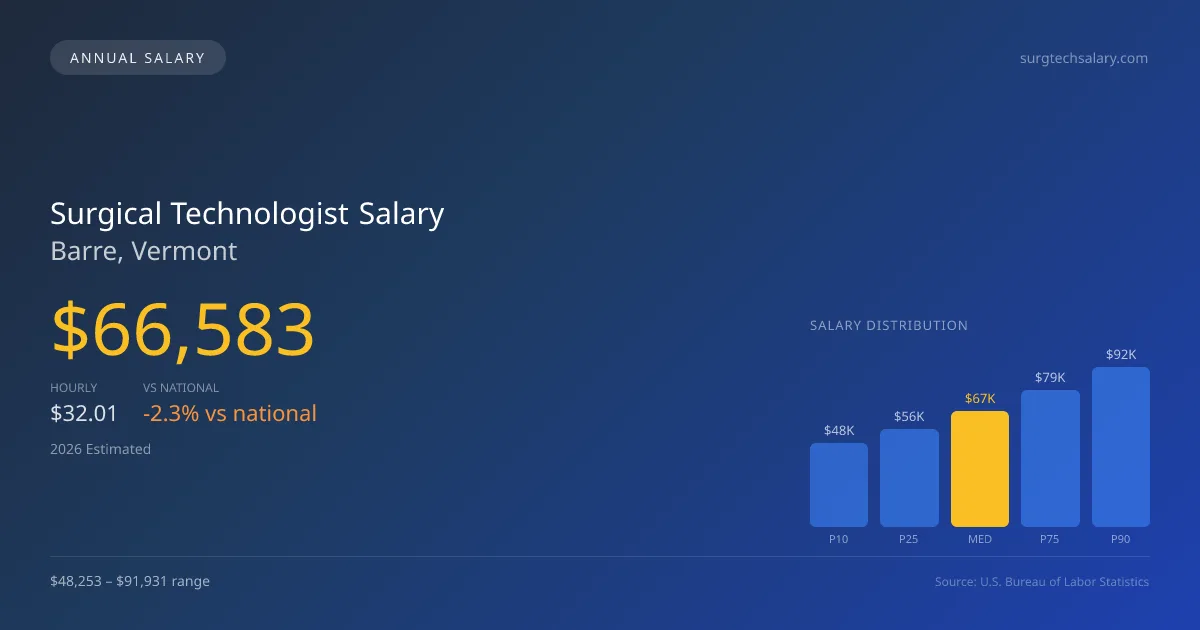
| Percentile | Annual | Hourly |
|---|---|---|
| Entry Level (P10) | $48,253 | $23.20 |
| Lower Range (P25) | $56,068 | $26.95 |
| Median (P50)(typical) | $66,583 | $32.01 |
| Upper Range (P75) | $78,929 | $37.94 |
| Top Earners (P90) | $91,931 | $44.19 |
Median Salary Position
2.29% below the national average
2026 Salary Percentile Distribution in Barre
In Barre, VT, the surgical technologist salary spread from the 10th to 90th percentile is $43,678 (2026 est.). At $66,583, the local median is 2.29% below the national median of $68,141.
Salary Calculator
At 40 hours/week in Barre: You'd be in the lower-middle range
How Barre Surgical Technologist Pay Compares
Barre median: $66,583/year (2026)
| Compared To | Median Salary | Barre Pays |
|---|---|---|
| Vermont Average | $70,533 | -5.60% less |
| National Average | $68,141 | -2.29% less |
Surgical Technologists in Barre, VT earn a median of $66,583 per year (2026 est.), which is 2.29% lower than the national median of $68,141 and 5.60% below the Vermont state average of $70,533.
Cost-of-Living Adjusted Salary
Barre has a cost of living 3.50% above the national average.
Adjusted salary = nominal × (100 / CoL index). CoL index: 100 = national average.
Barre, VT has a cost-of-living index of 103.5 (above the national average of 100). While the nominal salary of $66,583 is competitive, the higher cost of living reduces purchasing power to an effective $64,331 — a 3.38% reduction.
Compare Purchasing Power
Select a city to see how your salary compares after cost of living
Select a city above to compare purchasing power
2019 BLS Actual
$47,196
2025 BLS Actual
$63,172
2026 Current Est.
$66,583
2019–2027 Growth
+48.7%
Salary Trajectory for Surgical Technologists in Barre (2019–2027)
2019–2025: actual BLS OEWS data for this metro area. 2026+: CAGR 5.40% projection.
| Year | Annual Salary | Status |
|---|---|---|
| 2019 | $47,196 | Actual |
| 2020 | $48,574 | Actual |
| 2021 | $47,421 | Actual |
| 2022 | $54,681 | Actual |
| 2023 | $59,224 | Actual |
| 2024 | $56,674 | Actual |
| 2025 | $63,172 | Actual |
| 2026(current) | $66,583 | Estimated |
| 2027 | $70,179 | Projected |
Based on 7 years of BLS OEWS data for the Barre metropolitan area, the median surgical technologist salary grew 33.9% from $47,196 (2019) to $63,172 (2025). At a 5.40% compound annual growth rate, salaries are projected to reach $70,179 by 2027 — a total increase of $22,983 (48.70%) from 2019.
Note: Historical values (2019–2025) are actual BLS OEWS figures for the Barre metropolitan area, sourced from annual Occupational Employment and Wage Statistics surveys. 2026–2026 figures are current estimates, and 2027 values are projections, calculated using a 5.40% CAGR derived from 7-year BLS historical data. Actual salaries may vary based on employer, experience, certifications, and local market conditions.
Salary by Experience Level
| Experience | Estimated Salary Range |
|---|---|
| 0-2 years (New Graduate) | $48,253 – $56,068 |
| 3-5 years (Mid Career) | $56,068 – $66,583 |
| 5+ years (Experienced) | $66,583 – $78,929 |
| 10+ years (Top Earner) | $78,929 – $91,931 |
Surg Tech, CST salary ranges estimated from BLS percentile data. Individual surgical technologist compensation varies by employer, certifications, and specialization.
Surgical Technologist Job Market in Barre
With only six surgical technologists currently employed in Barre, the job market is relatively small but competitive. The cost of living index for the area sits at 103.5, indicating that while expenses are higher than the national average, salaries are also aligned to reflect this reality. Among local employers, those within hospital operating rooms tend to offer more competitive surgical technologist pay compared to ambulatory surgery centers and specialty clinics. Key factors influencing the salary range include specialization, such as cardiovascular or neurosurgery, which can demand higher remuneration. Additionally, skills in robotic surgery certification or roles as a surgical first assistant may unlock further financial incentives. To maximize pay in Barre, aspiring technologists should focus on achieving relevant certifications, gaining experience in high-demand specialties, and considering opportunities with travel surgical tech agencies, which can often offer attractive rates.
More salary data for Barre, VT:
Frequently Asked Questions
How much do surgical technologists make in Barre, VT in 2026?
Is Barre, VT a good place to work as a surgical technologist?
Can surgical technologists make $100K in Barre?
What is the cost-of-living adjusted surgical technologist salary in Barre?
How much does a surgical technologist make per hour in Barre?
Related Pages
Compare Salaries
Career Resources
Nearby Cities in Vermont
Written by Jessica Thompson, BA, CST
Career Analyst
Jessica has over 10 years of experience as a surgical technologist. She specializes in orthopedic surgical procedures. Jessica works at a community hospital.
Methodology & Data Source
Salary figures on this page are 2026 projections based on the Bureau of Labor Statistics Occupational Employment and Wage Statistics (OEWS) survey, May 2026 release. The BLS reported a median annual salary of $63,172 for surgical technologistsin the Barre metropolitan area. A 5.40% compound annual growth rate (CAGR), calculated from 6-year national BLS wage trends, was applied to project current 2026 compensation. Percentile ranges (P10–P90) represent the full salary distribution across experience levels and practice settings in this market.
Data Sources & Methodology
Salary data for Barre is estimated from official BLS state-level occupational wage data (2025), adjusted for regional cost-of-living differences using BEA RPP (Regional Price Parities).
2026 figures are projected from 2025 BLS data using a compound annual growth rate (CAGR) of 5.40%, derived from historical BLS wage trends for surgical technologists (SOC 29-2055).
Compiled and verified by Jessica Thompson, BA, CST, a licensed surgical technologist with 10+ years of clinical experience. · View source data at BLS.gov